
Nov 17, 2023

All your Tests and Mocks in One Place with Skyramp Dashboard
#kubernetes #testing #devops #microservices
Skyramp gives you the tools you need to make integration and performance testing for distributed applications easier. One way Skyramp helps you save time and be more productive is with the Skyramp Dashboard. The Skyramp Dashboard allows you to view the details of your test results, see your active mocks, and track all of your test runs.
In this post, we will take a deep dive into using the Skyramp Dashboard for testing microservices in a Kubernetes cluster. If you're a developer or devops engineer looking to streamline your testing workflow for distributed applications, you've come to the right place.
Setting Up
Before we get started, let's make sure you have a suitable testing environment in place.
Install the Skyramp CLI
First things first, you need to have the Skyramp Terminal Client installed. If you haven't already done this, you can find the install steps here.
Register your Kubernetes Cluster
Next, you will need to have a Kubernetes cluster registered with Skyramp. You have two choices. From the Skyramp CLI, you can either: (1) register an existing cluster with skyramp cluster register, or (2) create a new cluster with skyramp cluster create. More details about these Skyramp CLI Commands can be found here.
Tip: For an easy way to follow along with this post, you can create a local Kubernetes cluster by stepping through this simple walkthrough. The tests and mocks referenced in this post will use the examples from the walkthrough. As shown in the steps from the walkthrough, we can create a local Kubernetes cluster from the sample project that is registered with Skyramp by running this command:
Once you have a Kubernetes cluster registered with Skyramp, you can double-check the current cluster by running:
This will produce output like:
With your testing environment in place, let's move on to deploying the Skyramp Dashboard to the cluster.
Bringing Up the Dashboard
To deploy the Skyramp Dashboard to your currently registered Kubernetes cluster, execute the following command:
This command automatically creates the Kubernetes assets for the dashboard like the client, the server, and a MongoDB Kubernetes operator within the Skyramp namespace of your cluster. It also sets up port forwarding for local access to the dashboard.
Once the dashboard is ready, the terminal client will provide you with a URL for access and then open the dashboard page in a new browser tab. The terminal output should look something like this:
Browsing the Dashboard
Using your browser to access the URL provided, you should see the Skyramp Dashboard main page. If you're starting from scratch without any test runs, you will just see an empty page with no tests. Once you run some tests, you will see a list of tests like this:
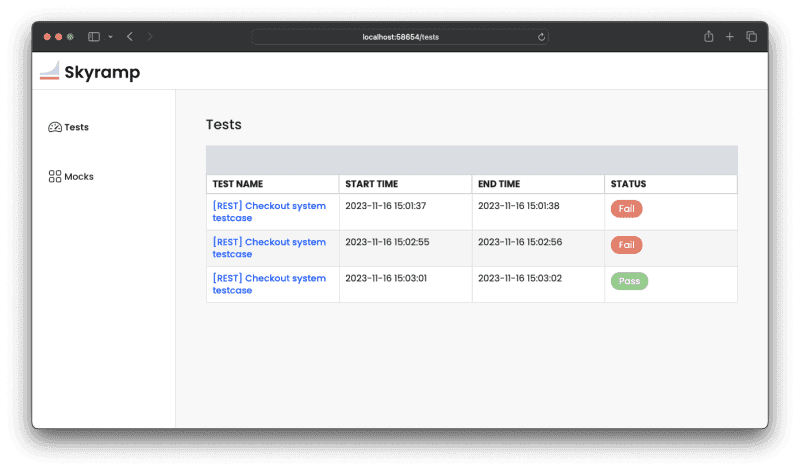
As you can see, this list shows the start and stop times of the tests along with the status of the results. The tests in the list above were run from the examples in the walkthrough referenced earlier. One such test from the walkthrough that we are using is a test of the checkout system, which can be run with Tester like this:
Try it yourself!
Viewing Individual Test Results
Once you have a list of tests in the dashboard, you can click on each test to view the details, including the specific test results for that run of the test.
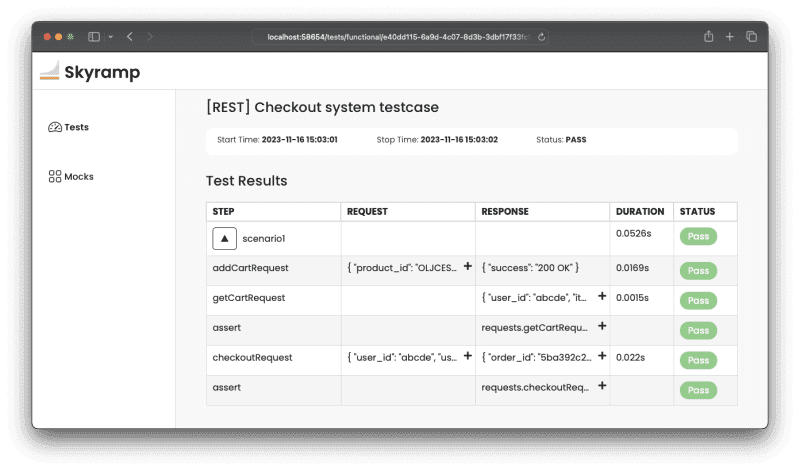
In this case, we are viewing the test results from a checkout test run that passed. You can expand the output to review the details. Here, our second assert that checks the quantity matched the output from the service and so there is no error.
Viewing Load Tests
You can also use the Skyramp Dashboard to view load test results, which have their own characteristics. Here is the test output from a load test we ran, again using an example from the walkthrough:
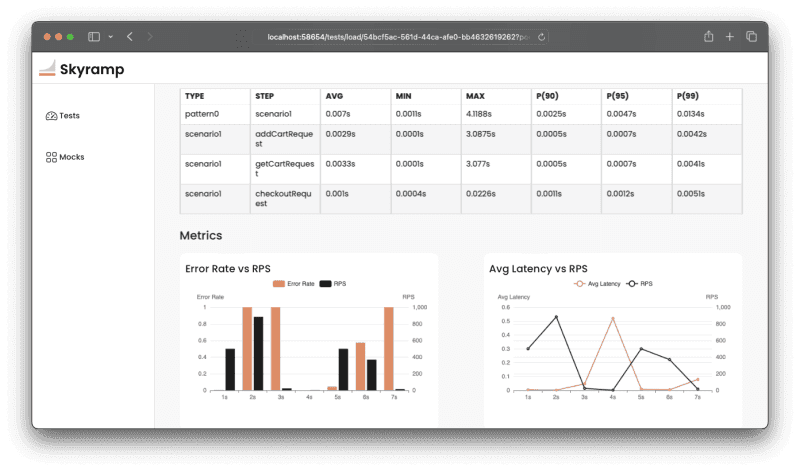
For load tests, the results will show stats such as: latency numbers, error rates, requests per second (RPS), and service utilization. The graphs above are autogenerated based on the metrics from the test run.
See your Active Mocks
Finally, the Skyramp Dashboard also displays any active mocks that have been applied by Mocker in the cluster. If you mocked the payment service from the walkthrough, as an example, you will see that mock in place as shown below:
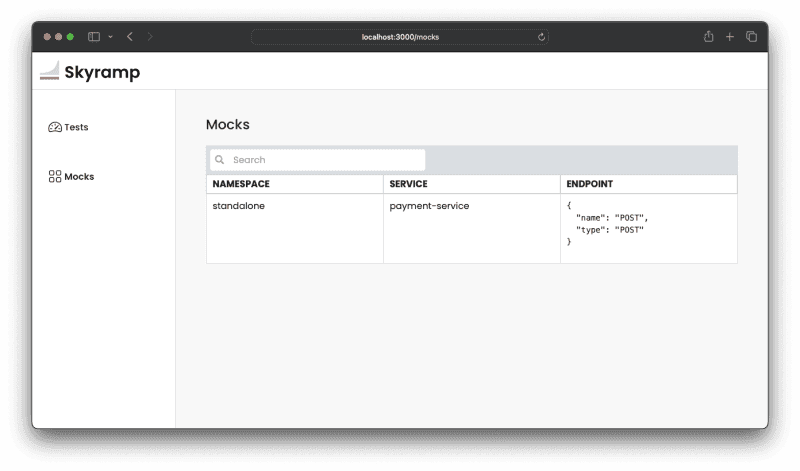
If you have multiple mocks applied, you will see a list of all your active mocks.
Stopping the Dashboard
To stop the Skyramp Dashboard and clean up resources, run the following command:
The dashboard will then terminate. You can always bring the dashboard back with skyramp dashboard up.
Summary
Congratulations! You are now equipped with the knowledge to use the Skyramp Dashboard on your Kubernetes cluster, making testing easier and saving you time. Whether it's tracking test results or managing active mocks, Skyramp Dashboard simplifies the process, making your development workflow smoother than ever.
If you have any questions or run into any issues, refer to the official Skyramp Dashboard documentation for further assistance. Happy testing!