Nov 8, 2023

Turbocharge Your Debugging with Skyramp's Hot Code Reload
#devops #microservices #kubernetes #coding
Are you tired of the traditional, cumbersome debugging process that requires re-deployments of microservices every time you want to test a code change? Skyramp now offers a game-changing feature known as Hot Code Reload. With this feature, you can debug your services in real-time without the hassle of re-deploying your application. You can attach your debugger, step through code, and make changes while your service continues to run without interruption.
In this blog post, we'll explore how to enable and use Skyramp's Hot Code Reload feature to turbocharge your development and debugging workflow for distributed applications. We'll first cover how to setup Hot Code Reload for any Kubernetes environment, then we'll step through a specific example that you can follow along using GitHub Codespaces.
In addition, we also have a YouTube video that walks through a quick summary of the Hot Code Reload feature from Skyramp:
How to Setup Hot Code Reload
The Hot Code Reload feature is available as a configuration option for the Skyramp Deployer tool. By using Deployer to deploy services to your Kubernetes cluster, you can take advantage of this feature.
To setup the Hot Code Reload feature, you need to include a 'debug' section in your target description file under the 'containers' section. This 'debug' section should specify various parameters to configure the debugging process. Here's an example of what this looks like:
Let's break down what each of these parameters means:
containerName: This is the name of the container you want to use in debug mode. You should specify the container associated with the service you wish to debug.runtimeType: Here, you specify the runtime type of your service, such as 'go,' 'node,' or 'python.' This information is crucial for Skyramp to set up the debugging environment correctly.command: This parameter represents the application's entry point that will run in a loop. It should be relative to the first path specified in the 'mountPaths'. It is the core of the debugging process, allowing you to inject code changes without disrupting the service.debugPort: The 'debugPort' is the local port of the running service that you want to debug. This port is where your debugger will connect to interact with your service.mountPaths: You can specify one or more paths that should be mounted to the remote container. These paths are the locations where your code changes will be applied. It's essential to ensure that your code and any necessary dependencies are mounted correctly.
The information above is also covered in the Skyramp Docs, where you can learn more about how to utilize all the Skyramp capabilities for testing distributed applications.
Looking under the Hood
Once you've configured the 'debug' section in your target description file, Skyramp's Hot Code Reload feature comes to life. Now, let's take a closer look at how it works:
Real-time Debugging
With Hot Code Reload, you can attach your debugger to the running service. This allows you to inspect the current state of your application and set breakpoints as needed.
Code Changes
As you debug your service, you can make code changes on the fly. These changes are instantly injected into the running application, giving you the flexibility to fix issues or implement new features without restarting the service.
Interactive Debugging
You can step through your code, inspect variables, and watch how your changes affect the behavior of your service. This interactive debugging experience greatly accelerates the troubleshooting and development process.
Streamlined Workflow
Hot Code Reload streamlines your debugging process by eliminating the need for frequent re-deployments. It saves you time and effort, enabling faster iteration and more efficient debugging.
Give It a Spin with Codespaces
In this section, we are going to step through an example of using Hot Code Reload to debug a sample application within a pre-configured deployment. Don't worry, though, no local setup is required because we are going to use GitHub Codespaces from a browser.
For our scenario, let's say a problem was reported with the cart service in our distributed application. We will attempt to find and fix the issue by setting up a Codespace environment to test and debug the cart service using Skyramp.
Note: the specific steps outlined below may be refined since the Skyramp product is rapidly evolving.
Step 1 - Fire Up the Codespace
Our starting point is the hot-code-reload-demo branch in Skyramp's letsramp/sample-microservices GitHub repo. You can use your browser to navigate to the correct branch in the repo here. The sample-microservices repo contains a demo project based on GCP's Online Boutique with added support for REST and Thrift APIs. This sample e-commerce application is perfect for demonstrating cloud-native development and testing, including debugging with Hot Code Reload with Skyramp.
To launch the Codespace, click the "Open in GitHub Codespaces" link from the README.md. You can also click the link below:
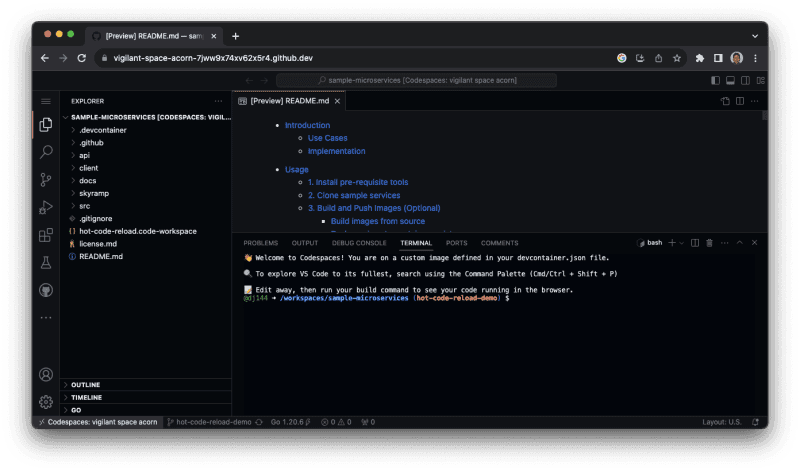
From the "Create a new codespace" page on GitHub, simply click "Create codespace". It will take a few moments to set up your Codespace. When the process finishes, you will see a VSCode environment like this:
Step 2 - Setup the Cluster and Deploy
Next, we will use the Skyramp CLI to create a Kubernetes cluster in the Codespace, and then deploy the services we need in order to test and debug.
Create a Kubernetes cluster from the Terminal in VSCode:
For debug purposes, we will need to install this SMB driver with Helm into the Codespace:
Also for debugging, the binary for the cart service needs to be built:
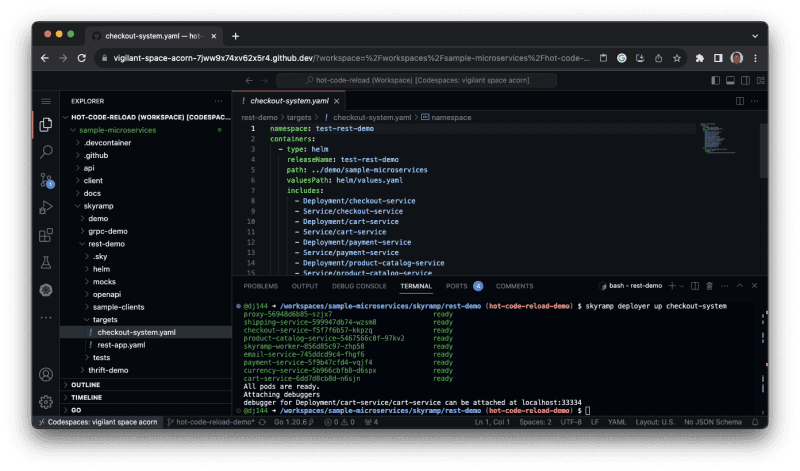
Finally, we deploy the services to the cluster using Skyramp Deployer:
You should now see that all pods are ready.
Step 3 - Test and Debug
We will be using a specific port for the debugger, so open thesrc/cartservice/.vscode/launch.json file in the repo and change the port parameter value to 2345.
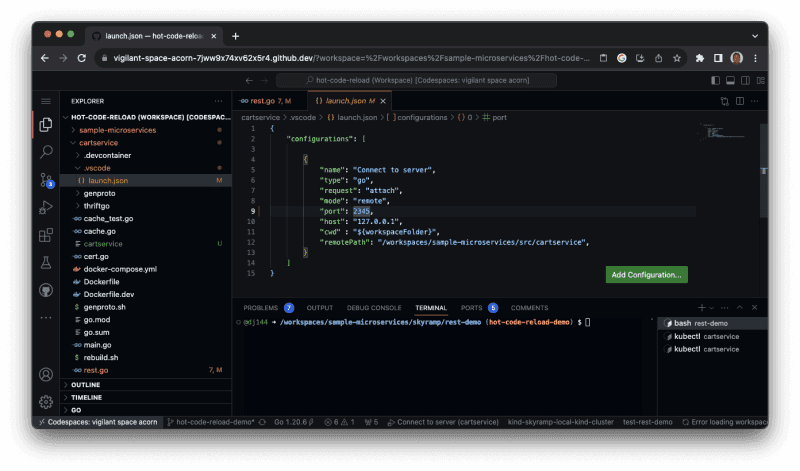
Then, create a second Terminal in VSCode using the drop down and selecting "bash". From there, we will start the debugger with the following commands:
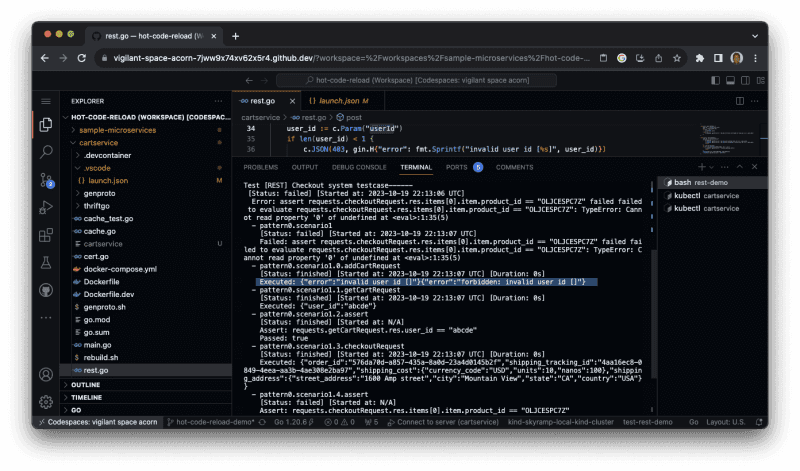
Now we can run our test scenario from the first Terminal window using Skyramp Tester:
We see that there is a failed test. It looks like a problem with the user ID.
Create a third Terminal to setup port forwarding for the debugger, and then execute the following:
Now we can attach the debugger in VSCode to step through the code. Open the src/cartservice/rest.go file and set breakpoint on line 33 at the post function. Since the error was related to the user ID, there might be an issue in this function.
Click the "Run and Debug" button on the left nav and then click the green play arrow to attach the debugger. You will see the status bar at the bottom of VSCode turn red. From the first Terminal, re-run the test as shown earlier. Execution will stop at line 33 where we set our breakpoint.
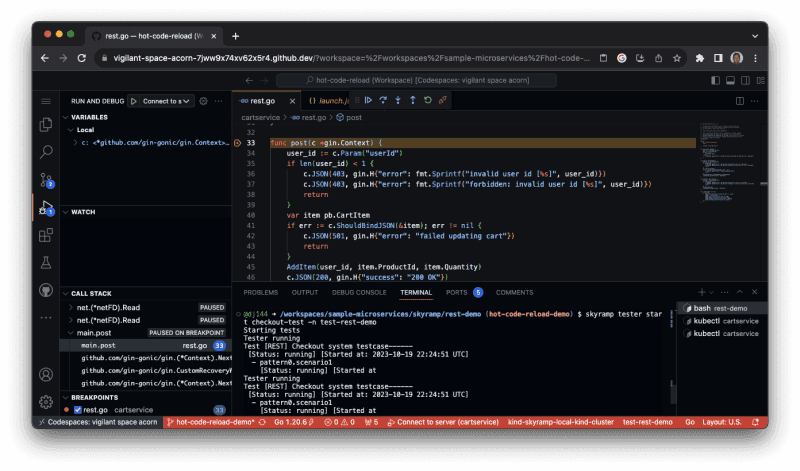
Using the debug controls to step over the code, we see that user_id is not populated. It looks like the code is using UserID instead of user_id for the parameter. That's most likely the issue, so let's fix it. We can continue execution and then disconnect the debugger in VSCode using the debug controls. Also, we can kill the debugger by running the following command in the first Terminal:
Step 4 - Fix and Validate
Now on to the best part -- fixing the bug. First, update the code in rest.go to use user_id instead of UserID on line 33. Then, rebuild the binary as we did earlier from the first Terminal:
Now, we restart the debugger in the second Terminal as we did earlier:
Switching back to the first Terminal, we can re-run our test with Skyramp Tester:
Look at that, the previously failed test now passes!
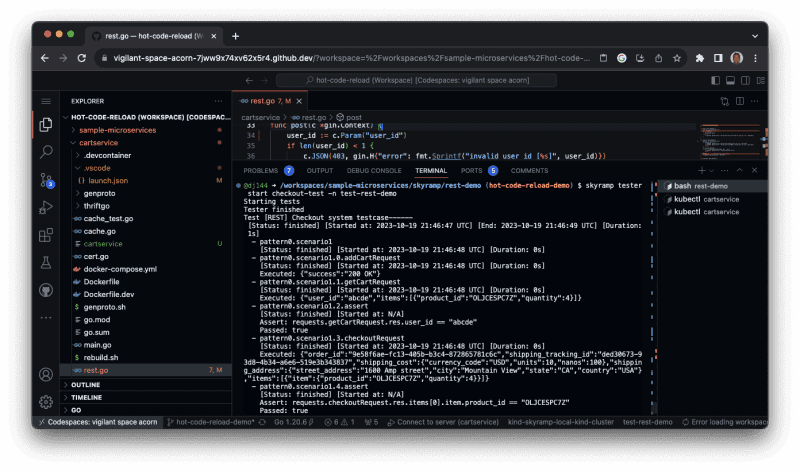
We found the bug, validated the fix, and did not have to re-deploy our cluster. Excellent work!
Benefits of Hot Code Reload
Skyramp's Hot Code Reload feature brings several benefits to your development and debugging workflow:
Time Savings
Say goodbye to the time-consuming process of re-deploying your application every time you make a code change. Hot Code Reload lets you make changes on the fly, saving you valuable development time.
Enhanced Productivity
With real-time debugging and interactive code changes, you can identify and fix issues more efficiently. This increased productivity helps you deliver high-quality software faster.
Reduced Downtime
Hot Code Reload minimizes service downtime for your system-under-test by allowing you to fix issues without restarting the entire application. This is particularly useful for services that must maintain continuous availability in a shared environment.
Improved Collaboration
Debugging is more accessible and collaborative with Hot Code Reload. Team members can work together to troubleshoot and enhance your services in real-time.
Flexible Testing
Quickly test new features or experiments by applying changes while your service is running. This flexibility encourages experimentation and innovation.
Summing It Up
In conclusion, Skyramp's Hot Code Reload feature is a game-changer for developers. It empowers you to debug your services in real-time, eliminate the need for re-deployments, and significantly accelerate your development and testing workflow. Simply configuring Skyramp Deployer and following the steps outlined in this blog post, you can start using Hot Code Reload to turbocharge your debugging process for distributed applications today. Happy debugging!
